Entropy is the measurement of the randomness. The concept originated in the study of thermodynamics, but Claude E. Shannon applied the concept to digital communications in his 1948 paper, ‘A Mathematical Theory of Communication.’ Shannon was interested in determining the theoretical maximum amount that a digital file could be compressed.
In simple terms, a file is compressed by replacing patterns of bits with shorter patterns of bits. Therefore, the more entropy in the data file, the less it can be compressed. Determining the entropy of a file is also useful to detect if it is likely to be encrypted.
In the field of cryptology, there are formal proofs that show that if an adversary can correctly distinguish an encrypted file from a file that is truly random with a greater than 50% probability then it is said that he has “the advantage.” The adversary can then exploit that advantage and possibly break the encryption. This concept of advantage applies to the mathematical analysis of encryption algorithms. However, in the real world, files that contain random data have no utility in a file system, therefore it is highly probable that files with high entropy are actually encrypted or compressed.
A contributor on code.activestate.com wrote a python program called file_entropy.py that can be run from the shell command line by with the following command:
python file_entropy.py [filename]
This shown below with the output:
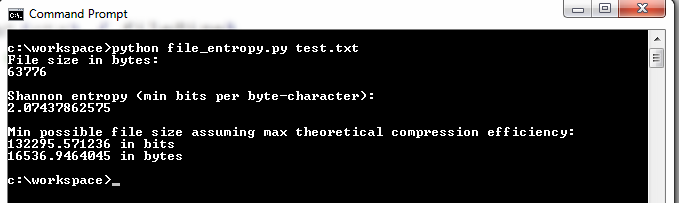
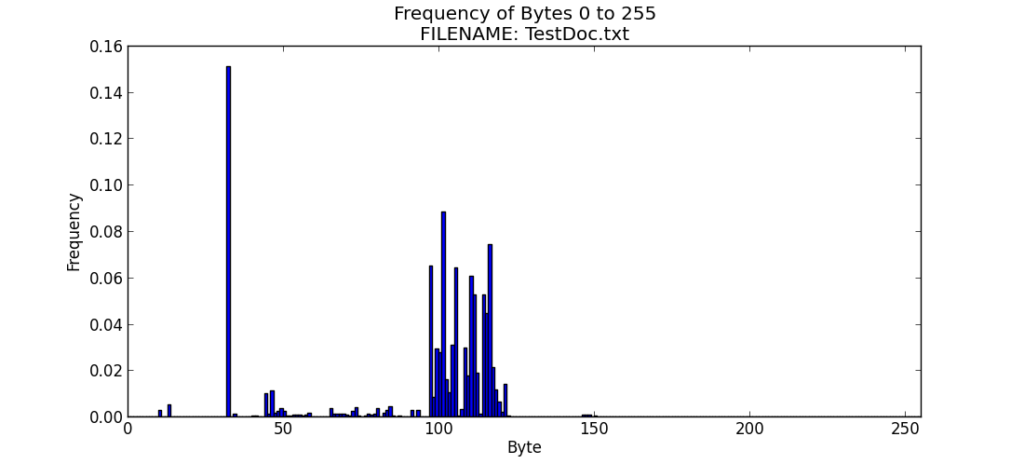
The closer the entropy value is to 8.0, the higher the entropy. It is often fun and useful to look at the frequency distribution of the bytes that comprise the file, so I have tweaked the code to create a frequency distribution bar chart using MatPlotLib
Note: If you do not have MatPlotLib and/or Python installed, I highly recommend Pythonxy to simplify the install and configuration process. There are awesome tutorials for both on the Internet as well.
I have named the new Python program graph_file_entropy, and it is listed below.
#
# graph_file_entropy.py
#
# Shannon Entropy of a file
# = minimum average number of bits per character
# required for encoding (compressing) the file
#
# So the theoretical limit (in bytes) for data compression:
# Shannon Entropy of the file * file size (in bytes) / 8
# (Assuming the file is a string of byte-size (UTF-8?) characters
# because if not then the Shannon Entropy value would be different.)
# FB - 201011291
import sys
import math

if len(sys.argv) != 2:
    print "Usage: file_entropy.py [path]filename"
    sys.exit()

# read the whole file into a byte array
f = open(sys.argv[1], "rb")
byteArr = map(ord, f.read())
f.close()
fileSize = len(byteArr)
print 'File size in bytes:'
print fileSize
print

# calculate the frequency of each byte value in the file
freqList = []
for b in range(256):
    ctr = 0
    for byte in byteArr:
        if byte == b:
            ctr += 1
    freqList.append(float(ctr) / fileSize)
# print 'Frequencies of each byte-character:'
# print freqList
# print

# Shannon entropy
ent = 0.0
for freq in freqList:
    if freq > 0:
        ent = ent + freq * math.log(freq, 2)
ent = -ent
print 'Shannon entropy (min bits per byte-character):'
print ent
print
print 'Min possible file size assuming max theoretical compression efficiency:'
print (ent * fileSize), 'in bits'
print (ent * fileSize) / 8, 'in bytes'

###  Modifications to file_entropy.py to create the Histogram start here ###
### by Ken Hartman  www.KennethGHartman.com

import numpy as np
import matplotlib.pyplot as plt

N = len(freqList)

ind = np.arange(N)  # the x locations for the groups
width = 1.00        # the width of the bars

#fig = plt.figure()
fig = plt.figure(figsize=(11,5),dpi=100)
ax = fig.add_subplot(111)
rects1 = ax.bar(ind, freqList, width)
ax.set_autoscalex_on(False)
ax.set_xlim([0,255])

ax.set_ylabel('Frequency')
ax.set_xlabel('Byte')
ax.set_title('Frequency of Bytes 0 to 255\nFILENAME: ' + sys.argv[1])

plt.show()
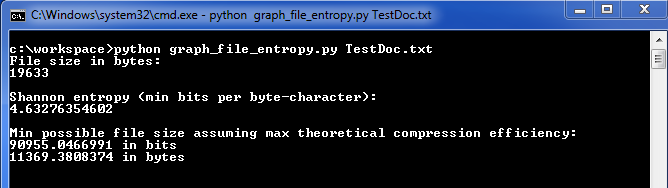
You can run it from the shell command line by with the following command:
python graph_file_entropy.py [filename]
I have illustrated this in the screenshots below, along with the results and a bar chart.
In the next posting, we will look at the use of this tool to examine various types of file formats.